Intro to Writing Suricata Rules
In my writeup for HTB Broker, for the initial access vuln, I mention as a potential fix for the vulnerability, it may be useful to "develop IDS/IPS" detection for payload specific traffic in order to potentially miitgate exploitation.
While there are many different formats that specific IDS and IPS solutions may offer, due to it's open nature and my having a bit more experience with it, let's look at building out an example for detecting the payload from my run through of HTB Broker in Suricata.
Understanding what the payload looks like
IDS rules more or less consist of really complicated regexes run against network packet content. When the regex matches, then we throw an alert, drop the packet, etc.
In order to know what we're detecting, if we have access to malware samples or the exploit kit we're wanting to detect, we might benefit from setting up a lab environment in order to directly sniff what sorts of network artifacts we get from the execution of the exploit.
Setting up in general
In order to build our sniffing lab, we should:
- Provision a VM. If we're doing this with a live malware sample, preferably one that's on an air-gapped or otherwise safely isolated network.
- Understand the kit or sample. If possible, audit the code, read all prior art that describes what the sample attempts to do, etc. For example, if we're to detect the sigs thrown by some malicious dropper script, do static analysis on that script and find out where it's "phoning home" to pull the second stage from, etc.
- Configure your networking and internal infrastructure accordingly. I.e. again, if we're looking at a dropper, setup routes so that instead of connecting to real C2 and getting your lab pwn't (you shouldn't be able to touch internet to begin with!), it connects to your test C2 on your lab network that serves harmless second stage payloads.
- Setup monitoring on the hosts involved. In this case, we'll be monitoring raw packets with Wireshark. In other cases, we might setup something like Sysmon to detect host artifacts, etc.
A whole seperate article could be built out regarding safe lab design, so maybe I'll write more about it sometime once I have a bit more time to dedicate to the idea.
This setup
More or less I've got
- an Ubuntu box to serve as both the attack and "victim" infrastructure; since I'm mostly looking for the exploit payload itself on the wire, and not looking for any host detections caused by actual exploitation, we won't be deploying ActiveMQ on the endpoint -- instead, we'll just setup a netcat listener on 61616 so that the exploit kit has a port to send stuff to. Actual exploitation would just result in a command shell being passed over the network, and there are plenty of default detections built for detecting command shell payloads -- we're looking to detect this specific CVE, so we need to look for the things that are specific to it instead.
- Our POC from last time; we'll even put it in bog standard config right from github since we're not really trying to send a shell back this time -- again, if we're passing a standard revshell over the network, we should be able to detect it through prior art already.
- Wireshark
Actually grabbing an analysing the traffic
We'll start off and grab wireshark from the repos since I don't have it installed on this host:
sudo apt-get install wireshark
We'll clone our POC into an arbitrary directory as before like in HTB Broker:
git clone https://github.com/evkl1d/CVE-2023-46604.git
Then we can fireup Wireshark itself with sudo wireshark (ws needs root to do pcap).
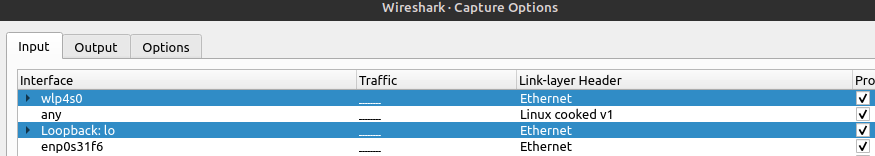
We want to make sure we select Capture > Options and ensure that our loopback interface is capturing:
Then we can start the capture with the sharkfin!
Build our NC listener:
nc -lvnp 61616
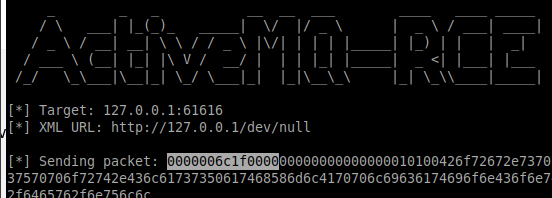
And fire off the sploit!
python3 exploit.py -i 127.0.0.1 -u http://127.0.0.1/dev/null
Ok, so what can we find in WS itself then?
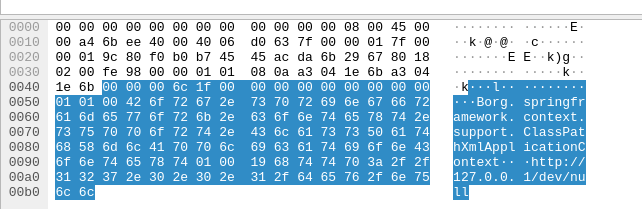
This looks like our payload:
As we can see, it's similar to the input we see coming on over netcat:

This makes me think that this is a somewhat "unique" indicator for the exploit kit. In the exploit kit's output itself, we can also see this 00 00 00 6c 1f part as well:
This makes me think that this part is also a "unique" part of the network traffic, and may be a network indicator for this exploit. Obviously, the particular host that we have here -- 127.0.0.1/dev/null -- will vary according to who is running the 'sploit (this is stager infra, which could be used as that horrible bottom of the pyramid of pain, but that's a weak indicator that will eventually change after the infra is resold after some months), so to target the exploit itself, we might say that something like the following is our IOC:
00 00 00 6c 1f 00 00 00 00 00 00 00 00 00 01 01 00 42 6f 72 67 2e 73 70 72 69 6e 67 66 72 61 6d 65 77 6f 72 6b 2e 63 6f 6e 74 65 78 74 2e 73 75 70 70 6f 72 74 2e 43 6c 61 73 73 50 61 74 68 58 6d 6c 41 70 70 6c 69 63 61 74 69 6f 6e 43 6f 6e 74 65 78 74 01 00
We arrive at this from some basic CyberChef shenanigans:

This is basically the above hexdump, minus the URL. If we were chasing some hot new exploit, we might decide to keep the URL in, or even target the URL specifically as a low fidelity but high relevancy indicator though, just because it's an active attack -- however, this could lead to problems years down the line once the C2 assets get resold and resold and resold and thus no longer actually reflects a threat.
So we'll take just the above as our IOC, so that we can build something that targets, minimally, the exploit kit, which while not perfect, is a step or two higher on the pyramid of pain than mere IP and hostname indicators.
Now then, in a real situation, we'd probably want to do some deep diving on two things:
- prior art and research related to this vulnerability
- Normal traffic for this protocol in the environment
By looking at these two factors, we could probably do some some more tuning and tighten up our indicator to figure out something that's significantly less likely to throw a false positive, but for the sake of a simple example thrown together from a prior CTF, I'm not really concerned with deep diving like that.
For example though, prior art may have done some (good) regex-fu for us, or it may have already weeded out some common baseline conditions in a corporate environment. They may even have some better general-case detections built for wider scope of detection that we can consider.
As for baselining against live "normal" traffic, we obviously get a sample of what good traffic looks like vs. the bad, and so we can weed out cases that would cause excessive triggers. We could possibly consult RFCs to this end as well.
From all this, in a "live" case, we could tune out "noise" and make the rule more effective at detecting real malicious activity.
Anyway, now that we have a basic network indicator to work with for our example, we can begin to build out our suricata rule to detect and hopefully block this thing, as was originally suggested in the CTF report.
Building the rule!
For our most basic Suricata rule, we could possibly do something like the following:
alert tcp $EXTERNAL_NET any -> $HOME_NET 61616 (msg:"Possible CVE-2023-46604 Exploit kit traffic"; flow:established,to_server; content:"|00 00 00 6c 1f 00 00 00 00 00 00 00 00 00 01 01 00 42 6f 72 67 2e 73 70 72 69 6e 67 66 72 61 6d 65 77 6f 72 6b 2e 63 6f 6e 74 65 78 74 2e 73 75 70 70 6f 72 74 2e 43 6c 61 73 73 50 61 74 68 58 6d 6c 41 70 70 6c 69 63 61 74 69 6f 6e 43 6f 6e 74 65 78 74 01 00|" sid:9999999; rev:1;)
Breaking this apart, we effectively have 3 sections:
| Action | Header | Rule Options |
|---|---|---|
alert |
tcp $EXTERNAL_NET any -> $HOME_NET 61616 |
(msg:"Possible CVE-2023-46604 Exploit kit traffic"; flow:established,to_server; content:"\|...\|" sid:9999999; rev:1;) |
Described:
Action
The action is more or less what Suricata will do when it detects the conditions of the rule. In this case, since this is a new rule that would likely need baselining or tuning, it's set to only alert. If suricata is configured as an IPS rather than simply an IDS, it can also be set to drop traffic, and perform other actions as detailed in the documentation
Header
The header defines several types of information for us. Starting off, we can see that it's defining the protocol for us to detect as TCP. We also have the option to define this as UDP, ICMP, IP or one of several supported application layer protocols like HTTP, etc. After this we have $EXTERNAL_NET any -> $HOME_NET 61616, which is effectively saying we want to trigger on traffic that's coming from "\$EXTERNAL_NET" (which is defined in our suricata config) from "any" port, and is going into our "$HOME_NET" to port 61616 (which is the pot targeted by the exploit in a typical configuration).
Rule options
These define the actual behaviour of our rule:
msg- This is basically the rule name that will appear when the IDS throws an alert
flow- This lets us set whether the state of flow (i.e. a TCP connection) is established or not. The exploit only sends the payload packet after the TCP handshake, so I was to see 2-way flow before I let this fire, hence I want to see that flow is
establishedandto_server, since this will define that the rule will only trigger if 2-way flow is detected and if flow is seen going to our server (in this case, our own ActiveMQ server, which is vulnerable)
- This lets us set whether the state of flow (i.e. a TCP connection) is established or not. The exploit only sends the payload packet after the TCP handshake, so I was to see 2-way flow before I let this fire, hence I want to see that flow is
content- This is the byte sequence we determined to be the IOC above. We can also supply strings, and by consulting the extensive documentation for various protocols and for payload keywords, we can build out more precision rules as we go through the tuning process by including information about bit depth of the detection, using PCRE patterns, etc.
sid- This is a unique ID for the rule. This is set to 9999999 here just for demonstration purposes.
rev- Basically, the version revisioning number. This is the first revision of this rule, and so I've set it to 1. This, like
sidis simply metadata, though.
- Basically, the version revisioning number. This is the first revision of this rule, and so I've set it to 1. This, like
Moving forward
Once we have our rule written, we would add the rule to our suricata install per the instructions here.
Once the rule is installed, we could do some basic function testing to ensure that it minimally catches the condition it was designed to detect. Afterwards, we may want to let it sit for a week in order to baseline it against conventional traffic in the environment. Once we have a feel for what sorts of activity triggers the rule, we can build in some exclusions to quiet down false positives, and then possibly set the rule to drop detected traffic rather than simply alerting on it.